Bitcoin Reaches its Monthly Low after a 5% Drop

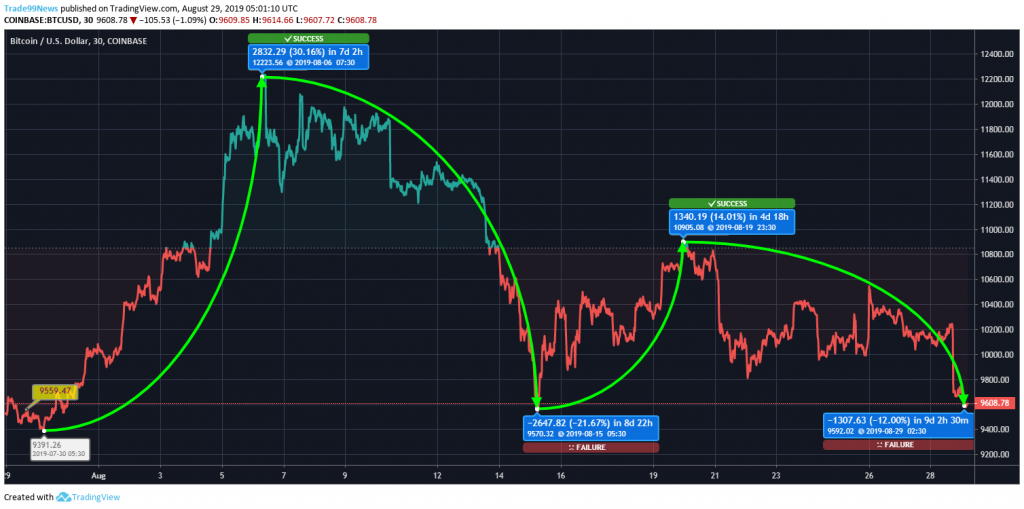
Bitcoin has been down by almost 5% over the last 24 hours, and it has been trading below $10,000. In the previous 30 days, the BTC has been through four phases of price shifts.
Bitcoin Price Analysis
Bitcoin got its first push between 30th July and 06th August and this push of 30.16% added $2832.29 to the BTC. However, this growth could not have lasted long, and it took a shift of 21.67%, and Bitcoin price fell to $9570.32 by 15th August. The third swing of the month came on 15th August, and by 19th August, it managed to reach $10,905.08. Since then, BTC has been showing volatility and an overall decline in the price. As per the latest figures, Bitcoin has lost 12% value and reached to $9592.02. The Market Cap on 29th July was $170,719,683,821, and the price of Bitcoin was $9559.47. The current Market Cap and the value of each coin are respectively 0.81% and 0.51% more than the data for last month.
BTC/USD Chart

Bitcoin has lost a huge amount and fallen to a level near its monthly low. However, this situation is not going to find an antidote anytime soon. The details of the next resistance and support levels are described below:
R1: $10116.97, R2: $10479.52 and R3: $10679.68
S1: $9554.26, S2: $9354.10 and S3: $8991.55


